publications
publications by categories in reversed chronological order. generated by jekyll-scholar.
2024
- Scalable approach to consumer wearable postmarket surveillance: Development and validation studyRichard M Yoo, Ben T Viggiano, Krishna N Pundi, and 5 more authorsJMIR Med. Inform., Apr 2024
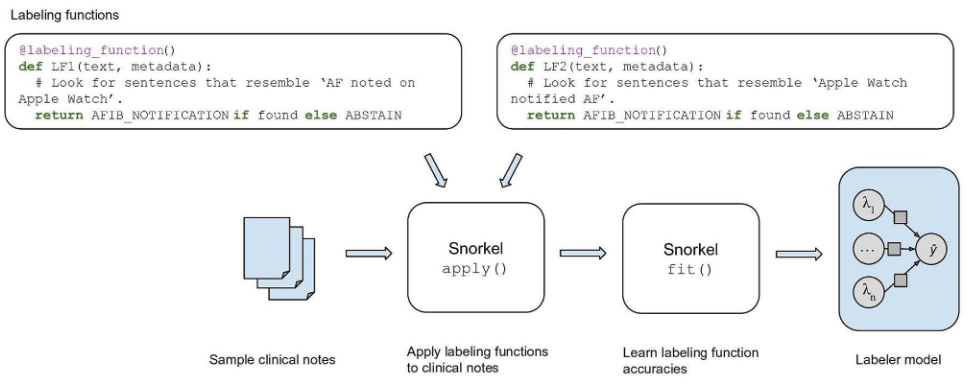
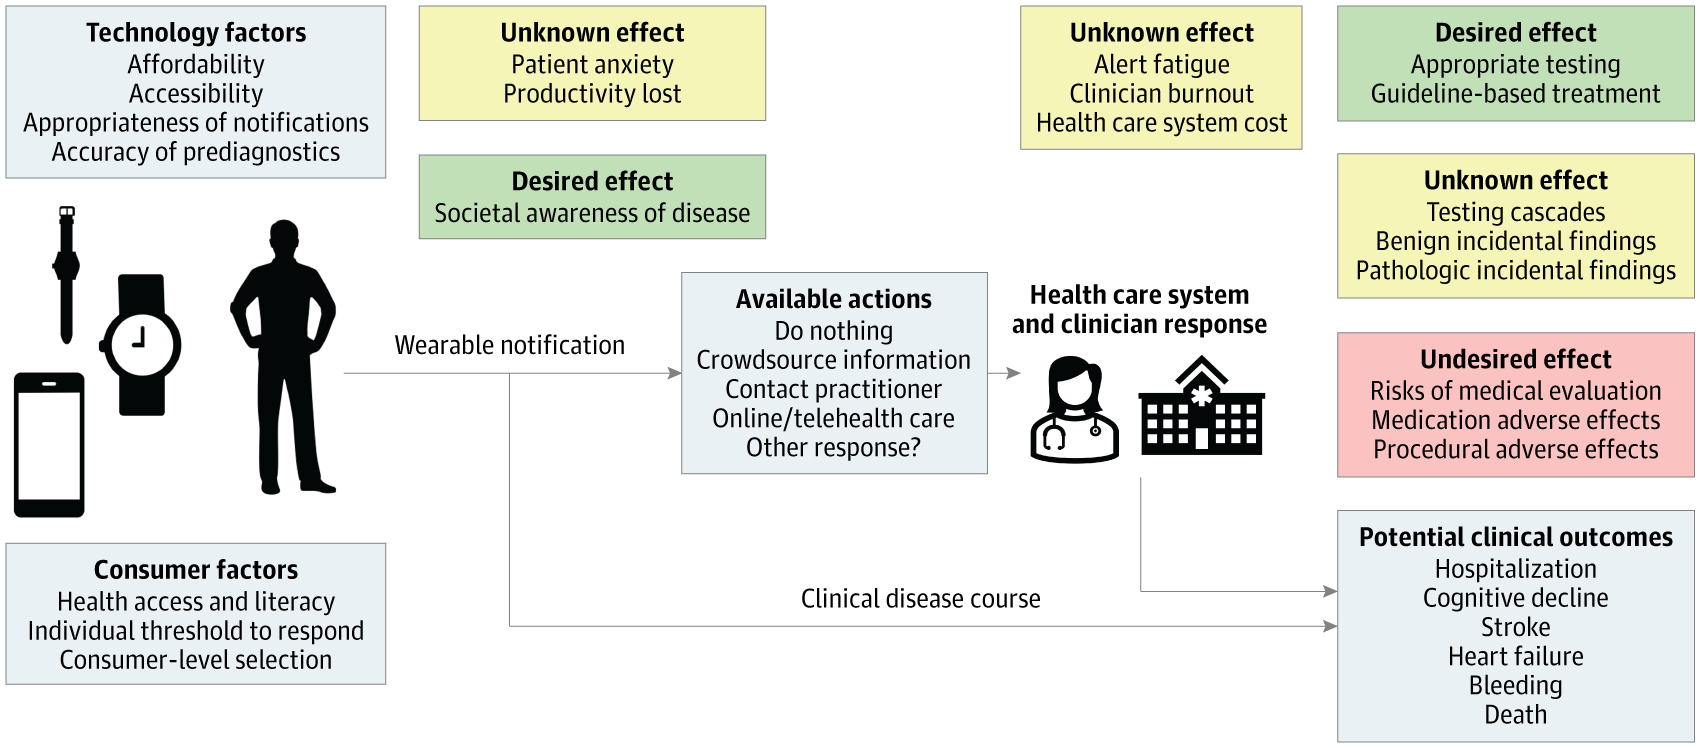
Background: With the capability to render prediagnoses, consumer wearables have the potential to affect subsequent diagnoses and the level of care in the health care delivery setting. Despite this, postmarket surveillance of consumer wearables has been hindered by the lack of codified terms in electronic health records (EHRs) to capture wearable use. Objective: We sought to develop a weak supervision-based approach to demonstrate the feasibility and efficacy of EHR-based postmarket surveillance on consumer wearables that render atrial fibrillation (AF) prediagnoses. Methods: We applied data programming, where labeling heuristics are expressed as code-based labeling functions, to detect incidents of AF prediagnoses. A labeler model was then derived from the predictions of the labeling functions using the Snorkel framework. The labeler model was applied to clinical notes to probabilistically label them, and the labeled notes were then used as a training set to fine-tune a classifier called Clinical-Longformer. The resulting classifier identified patients with an AF prediagnosis. A retrospective cohort study was conducted, where the baseline characteristics and subsequent care patterns of patients identified by the classifier were compared against those who did not receive a prediagnosis. Results: The labeler model derived from the labeling functions showed high accuracy (0.92; F1-score=0.77) on the training set. The classifier trained on the probabilistically labeled notes accurately identified patients with an AF prediagnosis (0.95; F1-score=0.83). The cohort study conducted using the constructed system carried enough statistical power to verify the key findings of the Apple Heart Study, which enrolled a much larger number of participants, where patients who received a prediagnosis tended to be older, male, and White with higher CHA2DS2-VASc (congestive heart failure, hypertension, age ≥75 years, diabetes, stroke, vascular disease, age 65-74 years, sex category) scores (P<.001). We also made a novel discovery that patients with a prediagnosis were more likely to use anticoagulants (525/1037, 50.63% vs 5936/16,560, 35.85%) and have an eventual AF diagnosis (305/1037, 29.41% vs 262/16,560, 1.58%). At the index diagnosis, the existence of a prediagnosis did not distinguish patients based on clinical characteristics, but did correlate with anticoagulant prescription (P=.004 for apixaban and P=.01 for rivaroxaban). Conclusions: Our work establishes the feasibility and efficacy of an EHR-based surveillance system for consumer wearables that render AF prediagnoses. Further work is necessary to generalize these findings for patient populations at other sites.
- Do multimodal foundation models understand enterprise workflows? A benchmark for business process management tasksMichael Wornow, Avanika Narayan, Ben Viggiano, and 15 more authorsarXiv [cs.AI], Jun 2024
Existing ML benchmarks lack the depth and diversity of annotations needed for evaluating models on business process management (BPM) tasks. BPM is the practice of documenting, measuring, improving, and automating enterprise workflows. However, research has focused almost exclusively on one task - full end-to-end automation using agents based on multimodal foundation models (FMs) like GPT-4. This focus on automation ignores the reality of how most BPM tools are applied today - simply documenting the relevant workflow takes 60% of the time of the typical process optimization project. To address this gap we present WONDERBREAD, the first benchmark for evaluating multimodal FMs on BPM tasks beyond automation. Our contributions are: (1) a dataset containing 2928 documented workflow demonstrations; (2) 6 novel BPM tasks sourced from real-world applications ranging from workflow documentation to knowledge transfer to process improvement; and (3) an automated evaluation harness. Our benchmark shows that while state-of-the-art FMs can automatically generate documentation (e.g. recalling 88% of the steps taken in a video demonstration of a workflow), they struggle to re-apply that knowledge towards finer-grained validation of workflow completion (F1 < 0.3). We hope WONDERBREAD encourages the development of more “human-centered” AI tooling for enterprise applications and furthers the exploration of multimodal FMs for the broader universe of BPM tasks. We publish our dataset and experiments here: https://github.com/HazyResearch/wonderbread
2023
- Harnessing artificial intelligence for risk stratification in acute myeloid leukemia (AML): Evaluating the utility of longitudinal electronic health record (EHR) data via graph neural networksRiya Sinha, Matthew Schwede, Ben Viggiano, and 7 more authorsBlood, Nov 2023
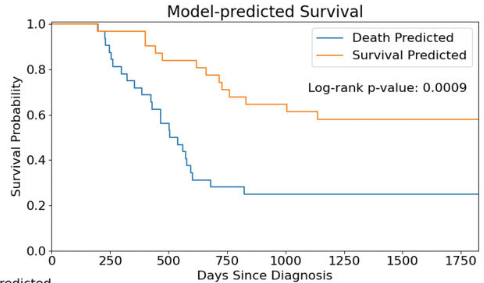
Background: AML is a life-threatening disease, and to determine which patients need allogeneic stem cell transplantation, hematologists risk-stratify each case. However, standard risk stratification using the European LeukemiaNet (ELN) criteria is focused on baseline mutations and chromosomal aberrations, and the risk estimate is not updated during a patient’s course. In other blood cancers, recalculating the risk with treatment response data can help guide the need for more intensive therapy (Kurtz, et al, Cell, 2019). Furthermore, deep learning graph neural networks (GNN) applied to EHR data have strong predictive power in a hematology context (Fouladvand, et al, J Biomed Inform, 2023). Thus, we evaluated the power of a GNN to predict survival in AML using longitudinal EHR data, specifically with labs and histological features that are not included in the ELN but may capture the treatment response. Methods: Patients who were seen at the Stanford Cancer Institute, had EHR data available within six months of diagnosis, and were diagnosed with AML between June 1998 and January 2021 were included in this retrospective analysis. The GNN was trained to predict survival at two years from diagnosis using the first six months of clinical data. Patients were excluded if they were lost to follow-up before two years or died before six months. Data were collected from structured databases associated with Stanford’s EHR, except that diagnosis dates were from Stanford’s Cancer Registry, and survival data was supplemented with other databases including the Social Security Death Index. Dysplasia, bone marrow cellularity, and bone marrow blast percentages from pathology reports (“pathology report data”) were extracted using text processing algorithms and weakly supervised machine learning (Ratner, et al, ArXiv, 2017). To represent time series information, we framed each patient’s timeline as a network (or “graph”) of events. The primary GNN model was a heterogenous graph transformer classifier with two node types: complete blood count (CBC) data and pathology report data (Hu, et al, ArXiv, 2020). Data from the same week were assumed to be from the same timeframe and connected with bidirectional edges. Data separated by longer time periods were connected with unidirectional edges of a separate edge type. The independent test dataset consisted of patients whose ELN 2022 classification was available, and to train the model, the remaining data were divided into train/validation splits of 0.9/0.1. Results: Of the 2,535 patients with survival data, 1,029 met inclusion criteria. Table 1 summarizes the data available in the EHR for each variable, and nearly all patients had CBC and pathology report data. The area under the receiver operating characteristic (AUROC) using the ELN 2022 criteria for predicting survival in the test dataset was 0.79. The AUROC curve for the GNN model was comparable at 0.76, despite not using any variables from the ELN criteria, and the model effectively stratified patients’ disease into high- and low-risk in the independent test dataset (hazard ratio [HR] 3.0, log-rank p = 0.0009). Interestingly, despite not having access to mutation or cytogenetic data, the high-risk cases were enriched in known high-risk mutations, like TP53 and RUNX1, and in high-risk chromosomal aberrations, like 5q deletion (Table 1). Although the model predictions correlated with the ELN criteria in some ways, they also stratified the ELN intermediate-risk AML cases into high and low risk (HR 6.1 for model-predicted high risk among ELN intermediate cases, p = 0.07). Conclusions: Risk stratification using artificial intelligence and longitudinal data from the EHR performed comparably to the ELN 2022 criteria and has the potential to further stratify the ELN categories. The model performed well despite only using histological features and lab values, which are more readily available and more frequently updated than next-generation sequencing results. In the future, this approach may further improve with a larger sample size and additional variables, such as measurable residual disease and treatment information. Given the heterogeneity and increasing complexity of AML classification, leveraging artificial intelligence to assist with classification will be crucial, and these results are a step towards a future where data are automatically extracted from the EHR and used for continuously updated risk stratification.
2021
- A metric for quantification of iodine contrast enhancement (Q-ICE) in computed tomographyT Szczykutowicz, Ben Viggiano, Sean D Rose, and 2 more authorsJ. Comput. Assist. Tomogr., Aug 2021
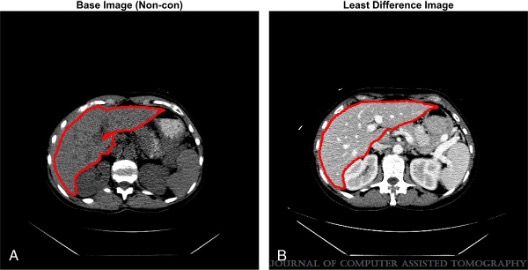
An automatable CT protocol and technologist workflow metric allowing for the quantification of CT iodine contrast agent enhancement was developed and applied to 312 patients. Background Poor contrast enhancement is related to issues with examination execution, contrast prescription, computed tomography (CT) protocols, and patient conditions. Currently, our community has no metric to monitor true enhancement on routine single-phase examinations because this requires knowledge of both pre- and postcontrast CT number. Purpose We propose an automatable solution to quantifying contrast enhancement without requiring a dedicated noncontrast series. Methods The difference in CT number between a target region in an enhanced and unenhanced image defines the metric “quantification of iodine contrast enhancement” (Q-ICE). Quantification of iodine contrast enhancement uses the noncontrast bolus tracking baseline image from routine abdominal examinations, which mitigates the need for a dedicated noncontrast series. We applied this method retrospectively to 312 patient livers from 2 sites between 2017 and 2020. Each site used a weight-based contrast injection protocol for weights 60 to 113 kg and a constant volume less than 60 kg and greater than 113 kg. Hypothesis testing was performed to compare Q-ICE between sites and detect Q-ICE dependence on weight and kilovoltage (kV). Results Mean Q-ICE differed between sites (P = 0.004) by 4.96 Hounsfield unit with 95% confidence interval (1.63–8.28), albeit this difference was roughly 2 times smaller than the SD in Q-ICE across patients at a single site. For patients between 60 and 113 kg, we did not observe evidence of Q-ICE varying with patient weight (P = 0.920 and 0.064 for 120 and 140 kV, respectively). The Q-ICE did vary with patient weight for patients less than 60 kg (P = 0.003) and greater than 113 kg (P = 0.04). We observed a roughly 10 Hounsfield unit reduction in Q-ICE liver for patients scanned with 140 versus 120 kV. We observed several underenhancing examinations with an arterial phase appearance motivating our CT protocol optimization team to consider increasing the delay for slowly enhancing patients. Conclusions A quality metric for quantifying CT contrast enhancement was developed and suggested tangible opportunities for quality improvement and potential financial savings.
- Applying a new CT quality metric in radiology: How CT pulmonary angiography repeat rates compare across institutionsSean Rose, Ben Viggiano, Robert Bour, and 3 more authorsJ. Am. Coll. Radiol., Jul 2021
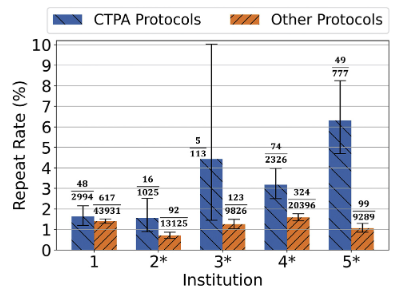
OBJECTIVES: To quantify overall CT repeat and reject rates at five institutions and investigate repeat and reject rates for CT pulmonary angiography (CTPA). METHODS: In this retrospective study, we apply an automated repeat rate analysis algorithm to 103,752 patient examinations performed at five institutions from July 2017 to August 2019. The algorithm identifies repeated scans for specific scanner and protocol combinations. For each institution, we compared repeat rates for CTPA to all other CT protocols. We used logistic regression and analysis of deviance to compare CTPA repeat rates across institutions and size-based protocols. RESULTS: Of 103,752 examinations, 1,447 contained repeated helical scans (1.4%). Overall repeat rates differed across institutions (P < .001) ranging from 0.8% to 1.8%. Large-patient CTPA repeat rates ranged from 3.0% to 11.2% with the odds (95% confidence intervals) of a repeat being 4.8 (3.5-6.6) times higher for large- relative to medium-patient CTPA protocols. CTPA repeat rates were elevated relative to all other CT protocols at four of five institutions, with strong evidence of an effect at two institutions (P < .001 for each; odds ratios: 2.0 [1.6-2.6] and 6.2 [4.4-8.9]) and somewhat weaker evidence at the others (P = .005 and P = 0.011; odds ratios: 2.2 [1.3-3.8] and 3.7 [1.5-9.1], respectively). Accounting for size-based protocols, CTPA repeat rates differed across institutions (P < .001). DISCUSSION: The results indicate low overall repeat rates (<2%) with CTPA rates elevated relative to other protocols. Large-patient CTPA rates were highest (eg, 11.2% at one institution). Differences in repeat rates across institutions suggest the potential for quality improvement.
- Effect of contrast agent administration on water equivalent diameter in CTBenjamin Viggiano, Sean Rose, and Timothy P SzczykutowiczMed. Phys., Mar 2021
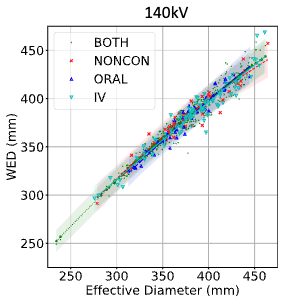
PURPOSE: Water equivalent diameter (WED) is the preferred surrogate for patient size in computed tomography (CT). It is better than geometric size surrogates and patient weight/height/BMI/age because it correlates the best with x-ray attenuation. The administration of oral/IV contrast agents increases a patient’s attenuation and should therefore increase WED. Here we study the clinically relevant effect of oral and IV contrast agent on WED. METHODS: We pulled 1703 routine adult abdominal/pelvis cases acquired at 100, 120, and 140 kV from our PACS under retrospective IRB approval. One hundred and forty cases cases had no oral or IV contrast (NONCON), 285 had just IV contrast (IV), 107 had just oral contrast (ORAL), and 1171 had both oral and IV contrast (BOTH). For each case, we measured the water equivalent and effective diameter (ED) from axial CT images. We plotted the WED versus the ED for each class of contrast. We used a linear regression model and omnibus F-test to determine if significant differences between WED distributions existed between the contrast groups for each kV. We then performed a post hoc analysis to determine if any significant differences existed in pairwise comparisons of the different contrast groups. Bonferroni correction was used to account for multiple comparisons. RESULTS: We found statistically significant changes at 100 and 120 kV with a maximum change of 2.1 mm. We measured a 25 mm spread (i.e., prediction interval) of WEDs within all four contrast groups. CONCLUSIONS: While our sample size was large enough to detect statistically significant differences between some of the contrast groups, the differences were clinically irrelevant when one considers that the change in size-specific dose estimate (SSDE) caused by our observations is roughly 1%.
- Apparatus for tomography repeat rate/reject rate captureT P Szczykutowicz, B T Viggiano, and S D RoseMar 2021
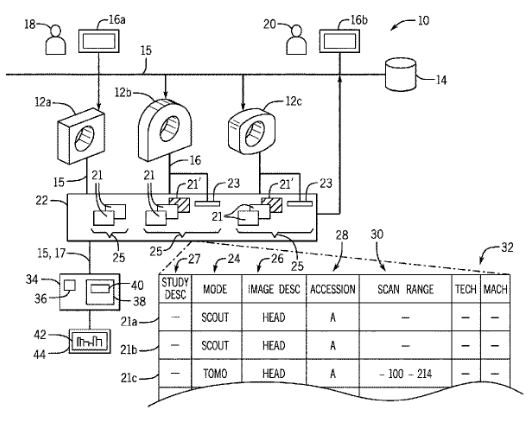
A system for capturing possible repeats or rejections of images occurring during tomographic imaging accommo dates the wide variety of imaging protocols by providing groupings of common imaging protocol types and highlight ing outliers of this grouping. The grouping may consider text descriptions of the images and their series, machine param eters such as tomographic and localizer scans, and overlap between images of any given series.
2020
- A multiinstitutional study on wasted CT scans for over 60,000 patientsSean Rose, Ben Viggiano, Robert Bour, and 2 more authorsAJR Am. J. Roentgenol., Nov 2020
OBJECTIVE. Repeated imaging is an unnecessary source of patient radiation exposure, a detriment to patient satisfaction, and a waste of time and money. Although analysis of rates of repeated and rejected images is mandated in mammography and recommended in radiography, the available data on these rates for CT are limited. MATERIALS AND METHODS. In this retrospective study, an automated repeat-reject rate analysis algorithm was used to quantify repeat rates from 61,102 patient examinations obtained between 2015 and 2018. The algorithm used DICOM metadata to identify repeat acquisitions. We quantified rates for one academic site and one rural site. The method allows scanner-, technologist-, protocol-, and indication-specific rates to be determined. Positive predictive values and sensitivity were estimated for correctly identifying and classifying repeat acquisitions. Repeat rates were compared between sites to identify areas for targeted technologist training. RESULTS. Of 61,102 examinations, 4676 instances of repeat scanning contributed excess radiation dose to patients. Estimated helical overlap repeat rates were 1.4% (95% CI, 1.2-1.6%) for the rural site and 1.1% (95% CI, 1.0-1.2%) for the academic site. Significant differences in rates of repeat imaging required because of bolus tracking (11.6% vs 4.3%; p < 0.001) and helical extension (3.3% vs 1.8%; p < 0.001) were observed between sites. Positive predictive values ranged from 91% to 99% depending on the reason for repeat imaging and site location. Sensitivity of the algorithm was 92% (95% CI, 87-96%). Rates tended to be highest for emergent imaging procedures and exceeded 9% for certain protocols. CONCLUSION. Our multiinstitutional automated quantification of repeat rates for CT provided a useful metric for unnecessary radiation exposure and identification of technologists in need of training.